Introduction to Salesforce Wave Analytics Cloud:
The Analytics Cloud is a Salesforce product, which is similar like the sales and service cloud, you can buy this product and it is much dynamic in real time. However, Wave is a platform that the Analytics Cloud is built on it and much similarly same as Salesforce.com and Force.com. Salesforce Wave Analytics is a cloud-based platform for connecting data from multiple sources, creating interactive views of that data, and sharing those views in dashboards.
The basic Wave and Analytics cloud represents:
Wave (Platform)
–Search based technology
–Key-value pairs
–Inverted Index
Analytics Cloud (Product)
–Cloud based
–Mobile first
–Self-service
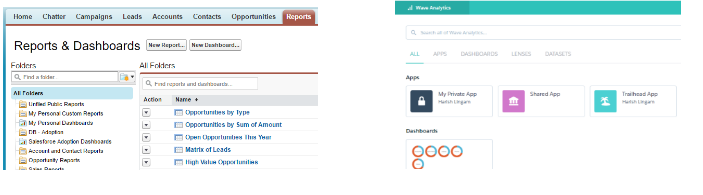
What’s the difference between Reports & Dashboards and Analytics Cloud
You might be thinking to yourself, “Why should I need Analytics Cloud? Reports & Dashboards provide good views on it?”. Depending on the type of business you work for,you can opt for need of the Analytics Cloud. However, for the ones that do, it will be down to limitations of Salesforce Reports & Dashboards.Speed and processing power becomes even more apparent in Analytics cloud. It can grab data from external systems like CSV,informatica and even from Salesforce CRM.
Salesforce Reporting Analytics Cloud
|
1. Salesforce data only 2. Analyse with reports & dashboards 3. Real-time data |
1. Explore with lenses & dashboards 2. Data updated on schedule 3. Salesforce & external data |
What Can You Do with Wave Analytics?
- Wave Analytics is a self-service analytics application that enables you to make sense of large amounts of data.
- You can also create dashboards to continually monitor key business metrics based on the latest data.
How does it work?
- Save your data, share them with others, and start discussions about them in Chatter.
Try Wave Analytics with a Developer Edition org:
- For this trail, you can’t use an old Developer Edition org. You must sign up for this special Developer Edition because it comes with a limited Analytics Cloud Wave Platform license and contains sample data required for this Wave trail.
- Go to https://developer.salesforce.com/promotions/orgs/wave-de and sign up here.
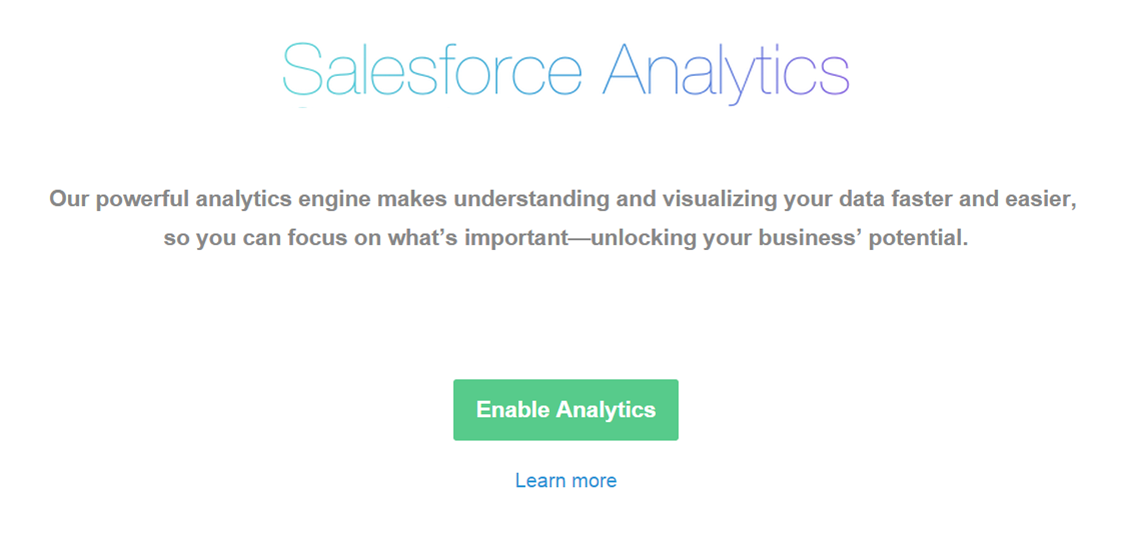
Enable Wave Analytics
- From Setup, enter Wave Analytics in the Quick Find box, then select Getting Started.
- Click Enable Analytics.
- Can you access Wave Analytics now? Not yet. Although it’s enabled, users—including the administrator—can’t access it until they’ve been assigned the right user permissions.
Platform License
Enabling Analytics Cloud
Max 400 users, 50 concurrent queries and 250 million registered rows per platform licenses. Buy multiple platform licenses to increase limits.
Give Users Permission to surf the Wave
- Go to Manage Users –> Users –> Click your Username.
- In the Permission Set License Assignments related list, click Edit Assignments.
- Select the Analytics Cloud Builder or Analytics Cloud – Wave Analytics Platform permission set license—whichever is available in your org—and then click Save.
Create and Assign Permission Sets
- Go to Permission Sets –> Click New –> Fill the label and keep the User License default value to –None–. –>Click Save.
- Scroll to the bottom of the permission set details page, and click System Permissions. –> Click Edit –> select the “Manage Wave Analytics ” user permission. –> Click SAVE.
- To assign this permission set to your user account, click Manage Assignments –> Click Add Assignments –> Select your user account, and then click Assign –> Click Done.
Enable Preview Thumbnails for All Lenses and Dashboards
- By default, preview thumbnails aren’t shown for lenses and dashboards based on datasets with row-level security.
- Why does Wave hide the thumbnails? Because they can expose sensitive data to users who don’t have access to certain rows in the dataset.
- From setup enter Wave Analytics –> select settings –> Select Show preview thumbnails for lenses and dashboards with row level-security enabled –> Click Save.
- Now you are ready to use wave analytics app.
Get to Know the Wave Analytics Interface
- The home page of the app shows all assets: apps, dashboards, lenses, and datasets. When you enable Wave, you get the two default apps, with no datasets, lenses, or dashboards.
- Apps- A fancy word for folder. An app contains a group of datasets, lenses, and dashboards that you can share with your colleagues.
- My Private App -This app is visible to you and only you. You can’t share My Private App with anyone.
- Shared App -This app is the opposite of My Private App. The Shared App is accessible by anyone who has access to Wave. Although it’s accessible by everyone, you can still ensure stricter security on datasets through row-level security.
How Much Does Salesforce Analytics Cloud Cost?
To experience Salesforce Wave Cloud Analytics, users are required to acquire the Wave Platform license. Pricing information for the Wave Platform is available by request.
User License for sales cloud- €75/user/month (billed annually)
User License for service cloud- €75/user/month (billed annually)
User License for both sales cloud and service cloud- €150/user/month (billed annually)
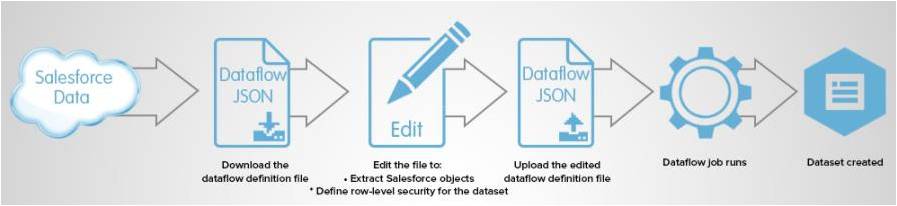
How it works
Analytics Cloud Components
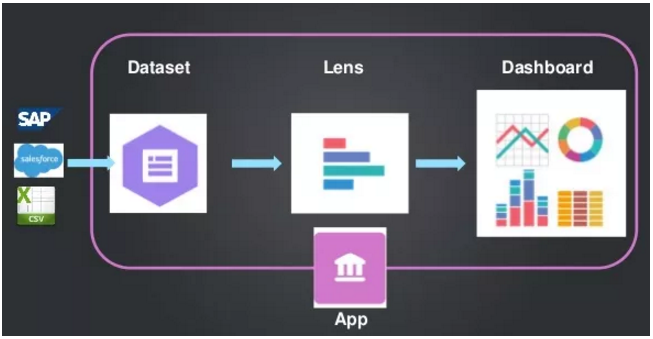
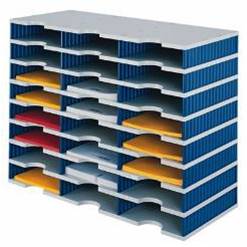
Dataset:
A dataset is a specific view into a data source based on how you’ve customized it. It could be based on a data pipeline or from an ETL vendor.
A dataset is simply a set of data. For example, it could be a list of opportunities or a list of users. You also might have an augmented dataset, which basically combines two datasets into one (e.g. opportunity line items and opportunity information).
The data used in these datasets can enter Analytics Cloud through any of three channels:
- A built-in standard Salesforce connector, which makes for a really nice GUI
- A manually uploaded CSV file
- Custom integrations through a middleware layer such as Informatica
LENS:
A lens is a particular view into a dataset’s data. It’s where you do exploratory analysis and visualizations. This is basically a single report based on a dataset.
Exploring a dataset involves four fundamental operations.
1.Measure:

A measure is a quantitative value, like revenue and exchange rate. You can do math on measures, such as calculating the total revenue and minimum exchange rate.
2.Group:
You can group by owner and stages etc.,
3.Filter:
You can filter like closing this month,year etc.,
4.View:
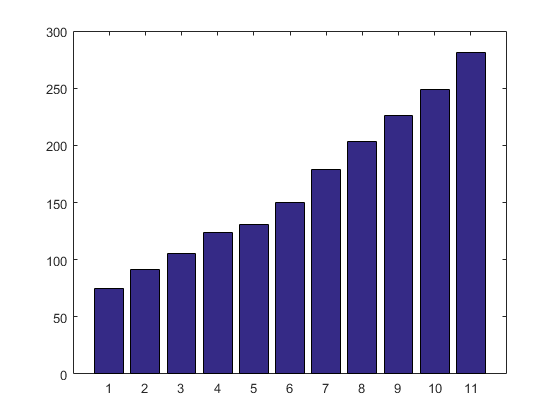
You can view charts as you want like bar chart,stacked bar chart,Donut chart etc.,
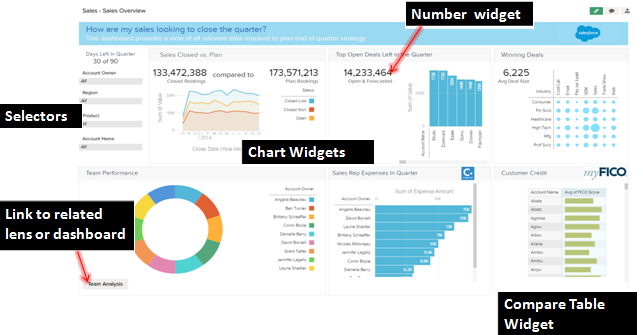
DASHBOARD:
A dashboard is an interactive collection of widgets showing different snapshots from one or more lenses to tell a story from different angles.A dashboard is a collection set of charts, metrics, and tables based on the data in one or more lenses.
This is how the dashboard looks like:
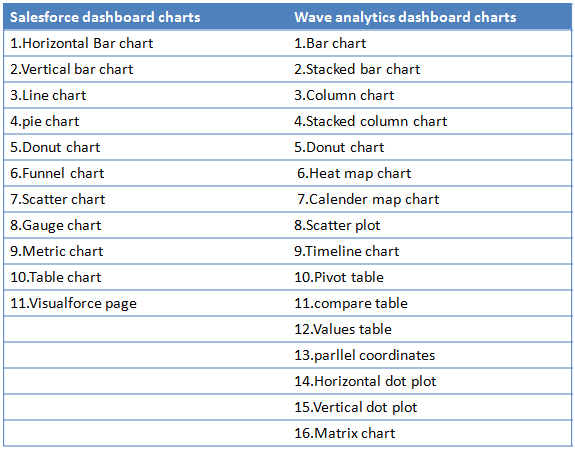
Available charts in salesforce Dashboard and wave analytics Dashboard are
In this blog the data is not fully explanatory of Dataset,Lens and Dashboard .In the next blog i will explain how to create Dataset,Lens and Dashboard.
Please post your comments or inputs if you feel this blog is helpful.