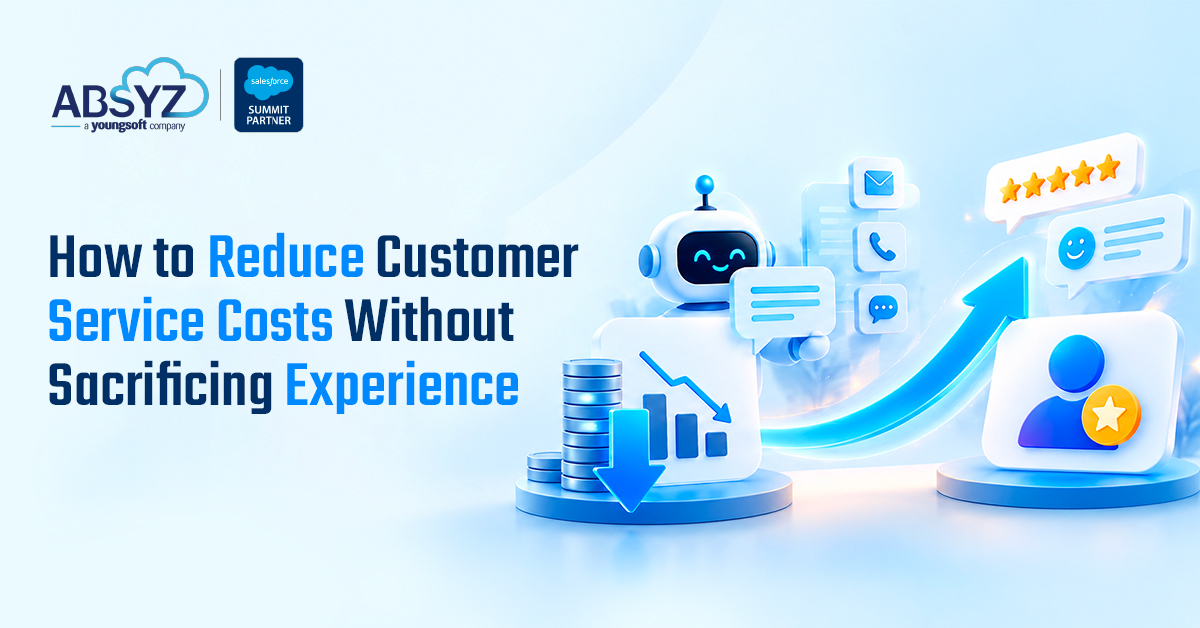
When a company needs to cut customer service spend, the first idea is almost always the same: fewer people, shorter calls, tighter queues. It shows up in the budget quickly. It also tends to show up a few months later in complaints, repeat contacts, and churn numbers.
The cheapest customer contact is the one that never has to happen. The next-cheapest is the one that was first resolved by the right resource. Cost reduction that works builds on those two facts. Cost reduction that fails pushes the same volume of problems through a thinner team and hopes nobody notices.
This article lays out how to lower service costs while protecting, and often improving, what customers experience. It covers the arithmetic behind service cost, six levers and the trap hidden in each, a worked model of what combined savings can look like, the guardrail measures that stop you cutting too far, and a sensible order of operations.
The Arithmetic Behind Service Cost
Strip away the detail, and service cost comes down to a simple relationship:
Total cost = number of contacts × cost per contact
That gives you only three ways to bring it down:
- Fewer contacts. Prevent the reasons customers need to contact you.
- Cheaper contacts. Handle the ones that remain with less effort or lower-cost resources.
- Fewer repeat contacts. Resolve things the first time so customers do not come back.
Most cost-cutting programs focus on the second, because it is the easiest to control from inside the service team. The first and third are usually bigger prizes, and they need cooperation from the rest of the business.
There is a useful name for the first and third: failure demand. It describes contacts that exist because something upstream went wrong, such as a confusing invoice, a missed delivery update, or an unresolved earlier issue. It is a demand you created, and it is the best place to find savings that customers will welcome.
Six Levers, and the Trap in Each
Lever 1: Remove avoidable contacts
What it looks like. Analyze why customers contact you and group the reasons. The top few usually include order status, billing confusion, password and access problems, and “I did not know this would happen.” Then fix the cause: clearer invoices, proactive delivery and renewal notices, better onboarding, simpler forms.
The trap. Service teams often lack the authority to change what other departments do. Without an executive sponsor, the findings turn into a report that nobody acts on. Treat the top contact reasons as business problems with owners and targets, not as service-team problems.
Lever 2: Self-service that actually resolves
What it looks like. A good help center, accurate answers, account tools that let customers do things themselves, and a way to reach a person when they get stuck.
The trap. Counting a “deflection” as a success when the customer simply gave up. A customer who read three articles, found nothing, and then called is a more expensive, more frustrated contact than if you had answered the phone. Measure self-service by whether the problem was solved, using follow-up contact rates and short feedback prompts, not by page views alone.
Lever 3: AI assistance and AI agents
What it looks like—two distinct uses. First, assisting your human agents with suggested replies, case summaries, knowledge lookup, and next-step recommendations, and second, handling simple, well-bounded requests directly, with a clear route to a person.
The trap. Giving an agent more independence than its data supports. An AI that cannot see order, billing, and entitlement information will give confident but incomplete answers, and the resulting escalations cost more than the contact would have. Start with assistance for your people, move to direct handling for simple cases where you can measure accuracy, and make handoff easy and context-rich. (Our guide to deploying AI agents first covers how to choose where to start.)
Lever 4: Smarter triage and routing
What it looks like. Classifying contacts at the start by topic, urgency, customer value, and complexity, then sending each to the resource best suited to resolve it. Simple requests go to automation or generalists, complex ones to specialists.
The trap. Over-routing. Too many queues and transfers send customers around the organization. Aim for fewer handoffs, not more precise ones, and track transfer rates as a quality signal.
Lever 5: Raise first-contact resolution
What it looks like. Give agents the information and authority to finish the job: a complete customer history, clear policies, the ability to issue small credits or make changes without escalating, and good coaching.
The trap. Pushing average handle time down at the same time. Pressure to shorten calls works directly against resolving the problem the first time. The better target is lower cost per resolved issue, not lower cost per call.
Lever 6: Choose the delivery model deliberately
What it looks like. Decide where service work is best done: in-house, outsourced, onshore, nearshore, offshore, or a hybrid. Complex, high-empathy or sensitive contacts may suit close-to-customer teams, while high-volume routine work and extended-hours coverage may suit a distributed model. (See our comparison of offshore, onshore, and nearshore teams.)
The trap. Choosing an hourly rate alone. A lower rate that brings more rework, weaker product knowledge, or poor handoffs can raise the true cost per resolved issue. Insist on quality measures, named leaders, strong knowledge transfer, and a trial period before moving large volumes.
One more lever deserves a mention because it cuts across the rest: agent productivity. When agents switch among several disconnected systems to answer a single question, time disappears. A single, unified view of the customer shortens every contact and improves accuracy. (See the business cost of disconnected systems.)
What Combined Savings Can Look Like
The levers stack, and the effect is larger than any one alone. Here is an illustrative model.
All figures are hypothetical and chosen to illustrate how the levers combine. Substitute your own volumes and costs.
Baseline: 200,000 contacts a year at an average cost of $6.00 each = $1,200,000. Assume 20% of human-handled contacts are repeats.
STEP | CHANGE | RESULTING ANNUAL COST | SAVING FROM THIS STEP |
Baseline | 200,000 contacts × $6.00 | $1,200,000 | |
1. Remove avoidable contacts | 10% of contacts prevented, leaving 180,000 | $1,080,000 | $120,000 |
2. Self-service and AI handle simple requests | 15% of remaining contacts (27,000) resolved at $0.80 each; 153,000 stay with people at $6.00 | $939,600 | $140,400 |
3. Agent assists with trimming handling effort | 8% lower cost per human contact ($6.00 to $5.52) | $866,160 | $73,440 |
4. Higher first-contact resolution | Repeat share of human contacts falls from 20% to 15%, so human contacts fall from 153,000 to 144,000 | $816,480 | $49,680 |
Total reduction: $383,520, or about 32%.
A few details behind the numbers:
- Step 2: 27,000 × $0.80 = $21,600, plus 153,000 × $6.00 = $918,000, for a total of $939,600.
- Step 3: 153,000 × $5.52 = $844,560, plus $21,600 = $866,160.
- Step 4: 122,400 first-time contacts ÷ 0.85 = 144,000 total human contacts. 144,000 × $5.52 = $794,880, plus $21,600 = $816,480.
Notice what happens to the headline metric. Total contacts fell from 200,000 to 171,000 (144,000 human plus 27,000 self-service or AI), and the blended cost per contact fell from $6.00 to about $4.77, a drop of roughly 20%. Yet the total cost fell by 32%. That gap exists because removing contacts entirely saves more than making each one cheaper. A team judged only on cost per contact would undervalue the best lever of all.
Real programs rarely deliver every step at full strength or on schedule, and each carries up-front costs for tooling, training, and change. Treat the model as a way to see where the leverage is, then build your own with conservative assumptions and a downside case.
The Guardrails: Numbers That Stop You Cutting Too Far
Cost metrics tell you what you saved. Guardrail metrics tell you whether you are paying for something you cannot see. Decide in advance which ones you will protect, and set thresholds that trigger a pause.
MEASURE | WHAT IT PROTECTS AGAINST |
Customer satisfaction (CSAT) | A general decline in how customers feel about the service |
Customer effort score | Savings that push work onto the customer |
First-contact resolution | Hidden growth in repeat contacts |
Repeat contact rate | Deflection that is really abandonment |
Escalation and transfer rate | Poor routing and weak first-line capability |
Abandonment and wait times | Under-staffing disguised as efficiency |
Retention and renewal in affected segments | Long-term damage that surveys miss |
Agent satisfaction and attrition | Burnout that eventually returns as a higher cost |
Add one rule: never trade away a guardrail for a cost target without a leader explicitly accepting the trade. That keeps the decision visible instead of letting it happen by accident.
Also, segment your customers. A change that is fine for low-value, simple requests may be wrong for high-value or vulnerable customers, who may deserve easier access to a person.
Putting It in Order
A sensible sequence builds credibility with quick wins while preparing the larger ones.
First: understand your demand. Classify a representative sample of contacts by reason, outcome, and whether they were repeats. Calculate cost per resolved issue, not just per contact.
Second: fix the top avoidable reasons. Pick the three to five largest and assign them to business owners outside the service team.
Third: improve what agents have in front of them. A unified customer view, better knowledge, and sensible authority limits usually pay back fast.
Fourth: introduce assistance before autonomy. Use AI to help agents first. Move to direct handling for narrow, measurable request types once accuracy is proven.
Fifth: tune routing and the delivery model. Once you know your baseline for demand and quality, decide where each type of work is best handled.
Throughout: watch the guardrails. Review them on a regular rhythm, and pause when they move the wrong way.
Where Salesforce Fits
For organizations running Salesforce Service Cloud, many of these levers a built into the platform you already have: case management and routing, knowledge, self-service experiences, a unified customer record, and AI features for assistance and agents. The value comes from configuring and connecting them well, with clean data and sensible permissions, not simply from switching features on. Check current product capabilities and licensing against Salesforce’s official documentation, since they change.
Before Your Next Planning Cycle
- Frame the goal as lower cost per resolved issue, not lower cost per contact.
- Start with failure demand: why are customers contacting you, and who can fix the cause?
- Make self-service count only when the problem is solved.
- Add AI to help your people before it works on its own.
- Pick your guardrail measures now, with thresholds and an owner.
- Estimate savings with your own numbers, and show a conservative case.
Service cost and service quality are not opposites. Where they appear to be, the cause is usually that cost was cut at the point of contact when the real savings were upstream, in the reasons customers needed to call at all.
If you would like help identifying where your service costs can come down without hurting experience, our Salesforce team can review your contact data and service setup with you.