Event Monitoring Part -I
Visualise Data using Wave Analytics
This is the first part of Event Monitoring Series where you will learn about following things
- Basics of Event Monitoring
- How to download Event Log File using Event Log File Browser Application
- How to create Dataset in Wave Analytics
- How to Visualise data in Wave Analytics
Event Monitoring Basics
Event Monitoring is a new weapon in Salesforce Administrator’s arsenal to identify any abnormal behaviour and secure your company’s data.It logs user activity, called events, in detail. This feature provides customers an easy to download, file-based API to extract log data that can help with a customer’s troubleshooting, performance management, and security audits. Event Monitoring can be used with 32 different types of events, including:
- Logout
- Login
- Report Export
- Salesforce1 Adoption (UI Tracking)
- API calls
- Visualforce
- Apex Trigger etc.
All these events are stored in log files. Log file will be available to use after 24 hours of occurrence of an event. Log files are available based on CreatedDate for the last 30 days when organization purchase User Event Monitoring or one day for Developer Edition organization. All event monitoring logs are exposed to the API through the EventLogFile object, however there is no access through the user interface. Each log file represents one type of log events happened over one day. Use Cases for Event Monitoring
- Identifying Compromised Accounts – Monitoring the behaviour of each user account to identify a compromised account.
- Monitor data loss by departing employees – Employees leaving company could take confidential data with them. Monitoring and taking against such actions is very important.
- Performance optimization – Optimizing the performance visualforce pages etc.
- Increased adoption – Observe how users from different departments of your organization are interacting with salesforce and evaluate their performance.
Let’s consider the first Use Case. Admin became suspicious of one particular user account. Now admin wants to check who else is using the account.One option is to find out the IP Addresses to get various locations from where the account is being accessed. Following steps will help admin to get his answers.
Downloading Event Log File using Browser Application
There are many ways to download Event Log Files in many ways, including:
- Event Log File Browser Application
- cURL script
- Python script
In this blog we will use Browser Application
Steps
- Open Link :https://salesforce-elf.herokuapp.com
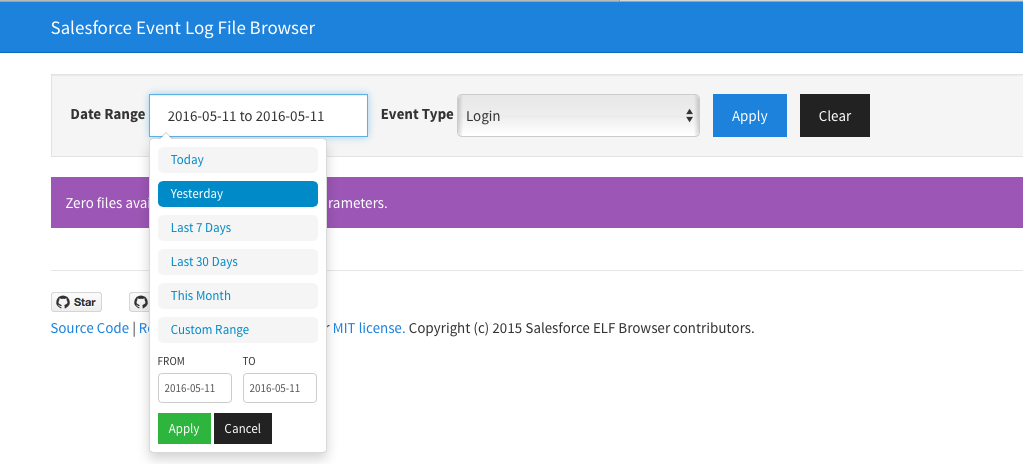
- Select either Production or Sandbox login and provide your credentials
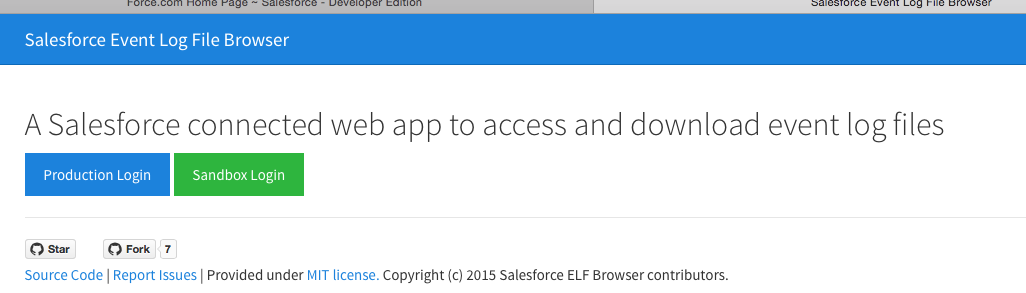
- Select date and event type and click Apply
- Once you click Apply you will get table just like below
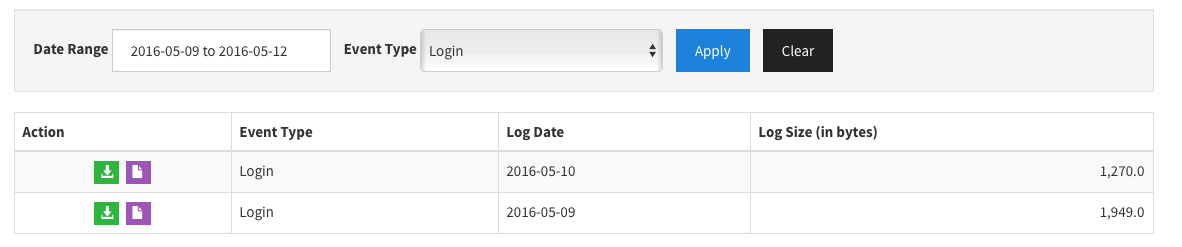
- Click on the Green download icon to download the specific file. It will be in .csv format.The other icon provides cURL shell script that can be used with cURL command line tool.
Now you have the Log File of the Login event. Lets use this log file to create some useful reports using Wave Analytics.
Wave Analytics
Wave Analytics is a powerful self-service analytics application. You need a Wave License to use Wave Analytics in your system. Wave Analytics provides option to integrate data from various sources to build useful insights to answer key questions of business users. Steps to use Event Log File and create reports(Lenses) in Wave Analytics
Steps
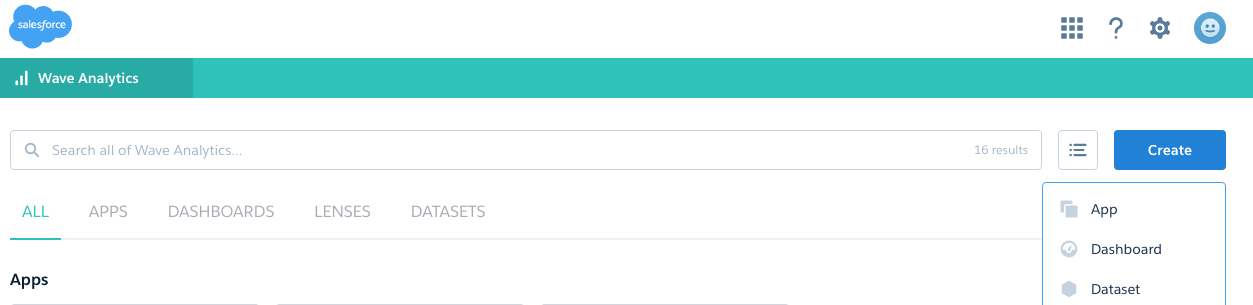
- Login to the Org where Wave Analytics is installed.
- Click on create and select Dataset
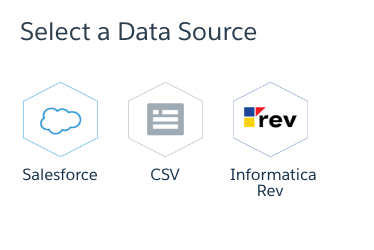
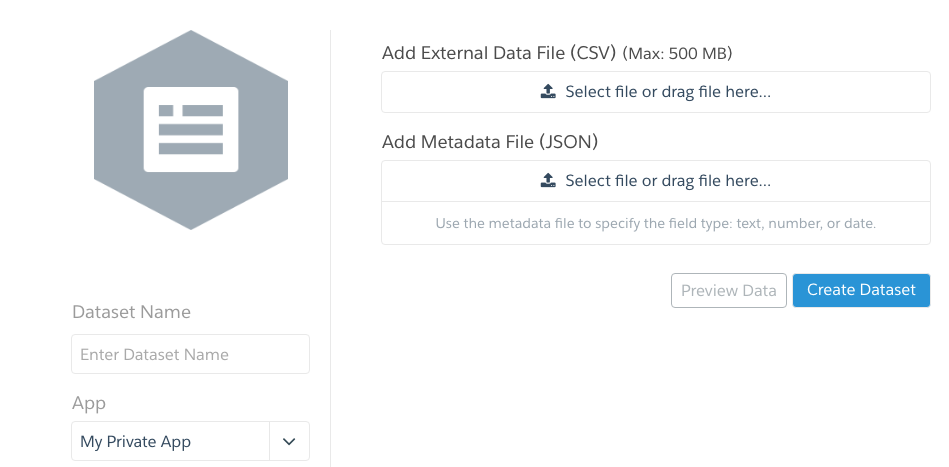
- Select Data source as CSV
- Add downloaded Event Log File in .csv format in “Add External Data File” section. A metadata JSON file will be created automatically. Enter Dataset Name and select the App(Folder) where you want to create the dataset. Click Create Dataset.
- Dataset as shown below will be created inside the selected App in previous step.
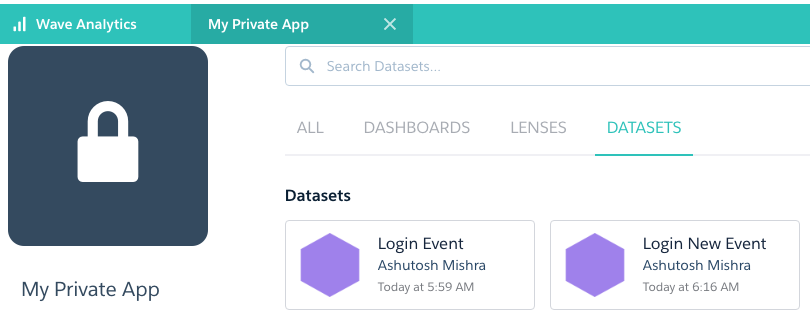
- Click on the dataset to create Lens(Reports).
 (The above report (Lens) was created by following steps
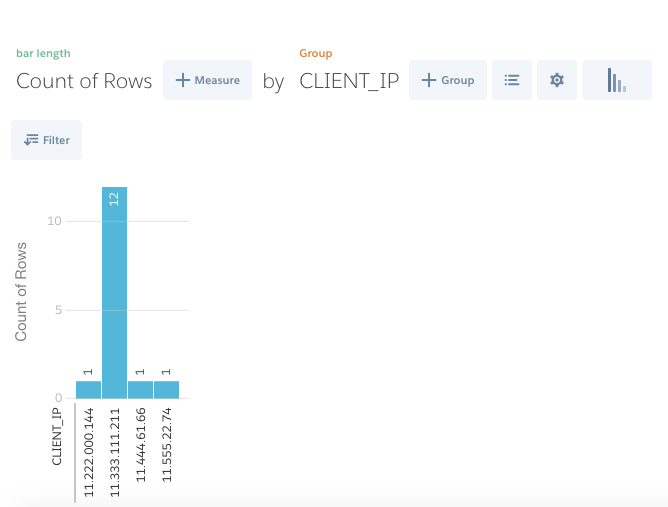
i. Click on the  icon(last icon) to select Column graph. ii. Click on the
  icon to create a group by CLIENT_IP. ) In the above graph Admin observes that login happened several times from one particular ip address. Also this ip address does not belong to admin’s company. Now admin can further investigate the ip address. In this way Wave Analytics can be used to provide more useful insights using data gathered from Event Log File. Also you can use the below Bash Shell Script to automate the process of downloading event log file and uploading it in Wave Analytics to create a Dataset https://github.com/atorman/elfBash/blob/master/elfWave_mac.sh . In our next blog in the Event Monitoring Series we will explore querying EventLogFile object using REST API.