Originally Posted on December 4, 2018; Last updated on November 5, 2020.
Einstein Analytics by Salesforce is a cloud-based AI-powered advanced analytics tool that helps in exploring data quickly and with Salesforce Analytics Query Language (SAQL) to query, manage your datasets and customize dashboards programmatically. Formerly known as Wave Analytics Cloud, it integrated very well with the Salesforce platform. We have already covered Wave Analytics in detail in our previous blog post “Introduction to Salesforce Wave Analytics Cloud”
Update: Einstein Analytics has a new name now, Tableau CRM, the tool remains the same. Read about this major update here.
Einstein Analytics dashboard is built up of many widgets, which is similar to a component over the Salesforce dashboard; however, a date filter or list filter can also be referred to as widgets in EA. For the purpose of our tutorial, we would be using the Toggle widget, which can be used to create a filter for the viewers on Analytics dashboard results based on date or dimension.
In the following example, we will create a filter for the Users on the date field as Quarterly and Yearly.
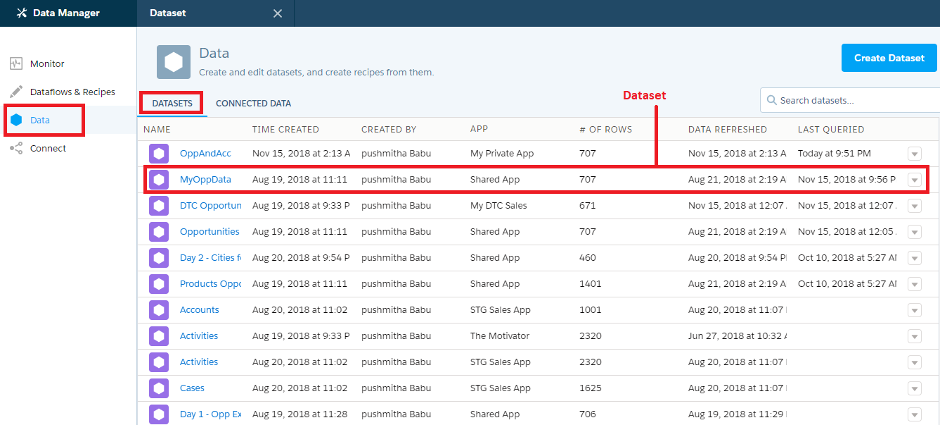
To begin, we will create a Dataset. In EA, a Dataset is a specific view of a data source based on how you’ve customised it. We’ve already covered steps to create a Dataset in “How to create a Dataset, Lens and Dashboard in Wave Analytics”. After creating the dataset, create a Dataset Recipe as shown below. You can find the created recipe in the Dataflows & Recipes from the sidebar menu.

Datasets in Einstein Analytics / Tableau
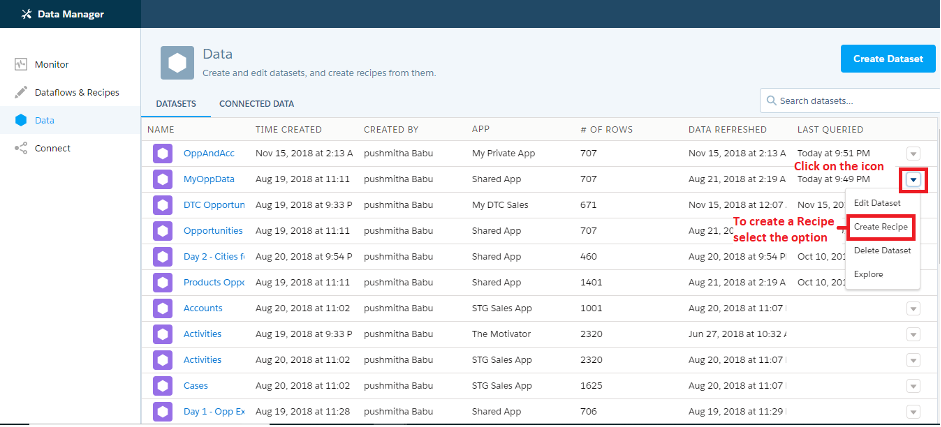
Create Recipe Option – Einstein Analytics / Tableau
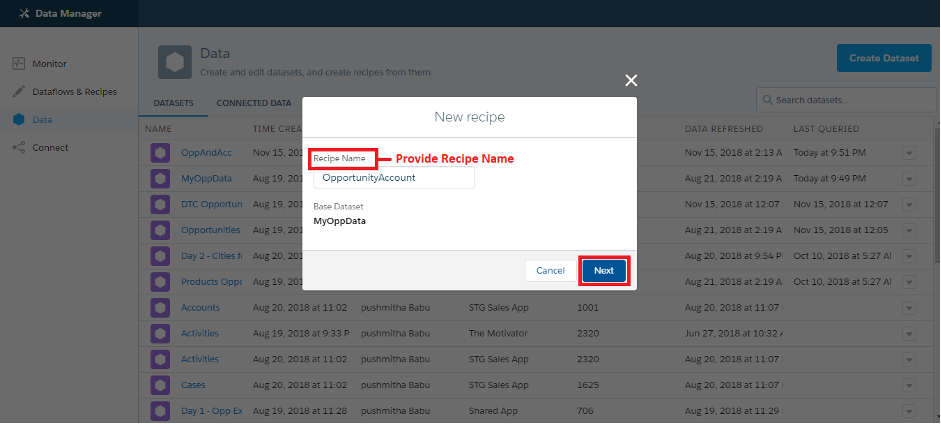
Provide Recipe Name – Einstein Analytics / Tableau
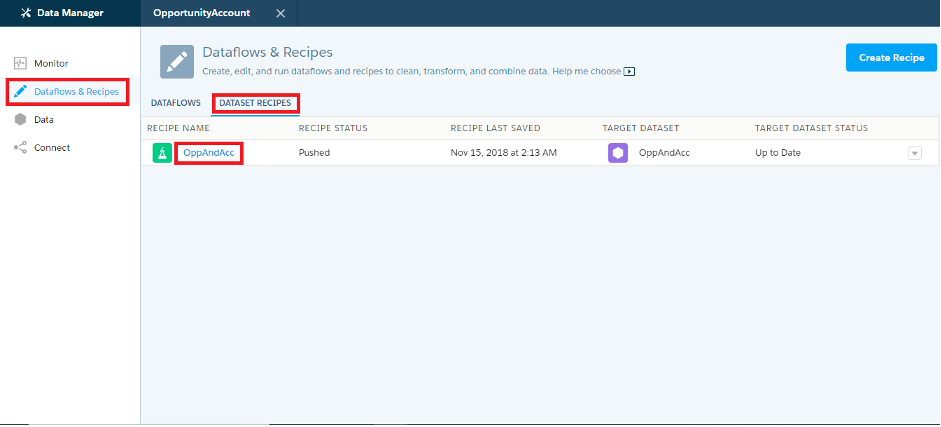
List of Data Flows & Recipes – Einstein Analytics
Create a Bucket
Click on the Recipe, you will be redirected to a table that shows all the data. We write the filter on the Close Date field in Opportunity. Create a bucket to categorise the fields.
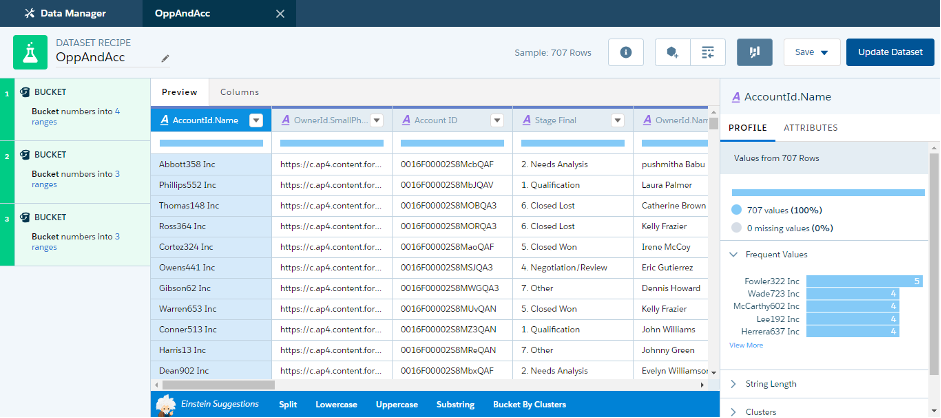
Recipe Editor / Customisation Pane
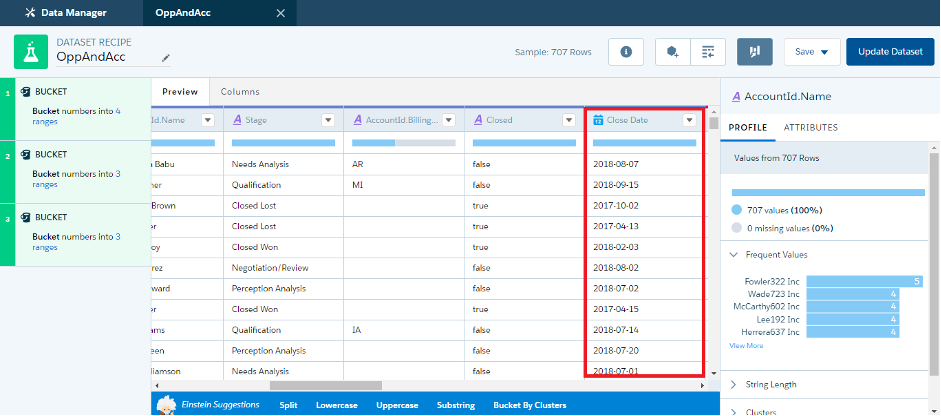
Row for the Bucket to be Created
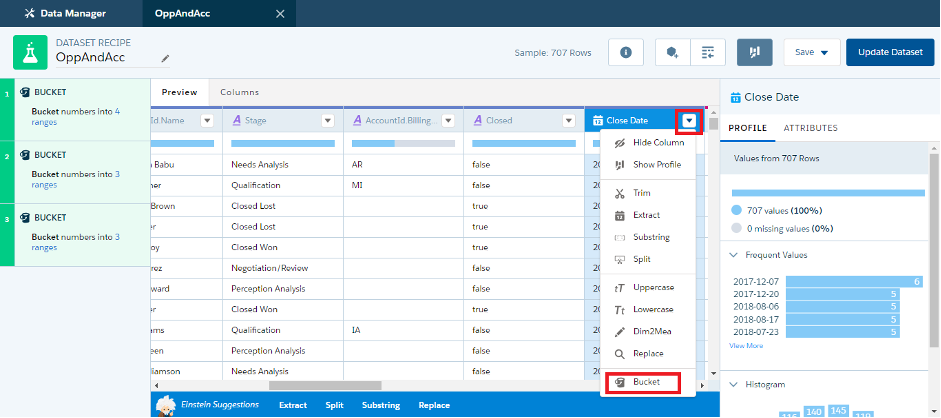
Creating Bucket from Data fields – Recipe – Einstein Analytics
You have 2 options shown while creating a Bucket. Choose the Relative option. A drop-down list appears below with the options by Year, Quarter, Month, Week or Day. Below you have another option to choose your range provided namings for the start and end of your selected type.
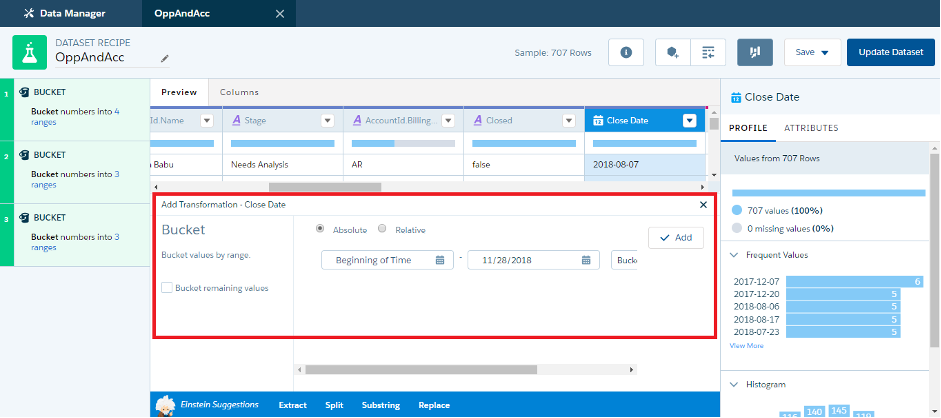
Bucket Customisation Pane – Select Relative.


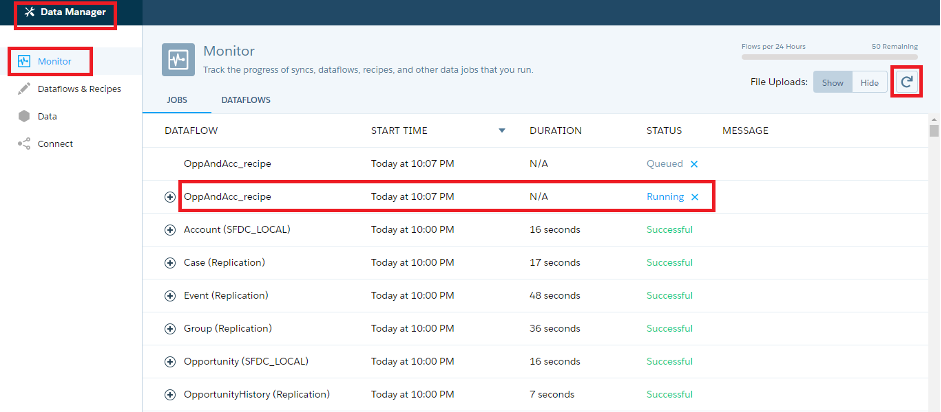
Now create two buckets: By Year and By Quarter. Select the range and name each range that you want to display. As you create each bucket, add the bucket to the Dataset and update as shown below. The Dataset Recipe will get updated and can be monitored from the Data Manager. In the left side panel click on the monitor tab, where you can check the status.
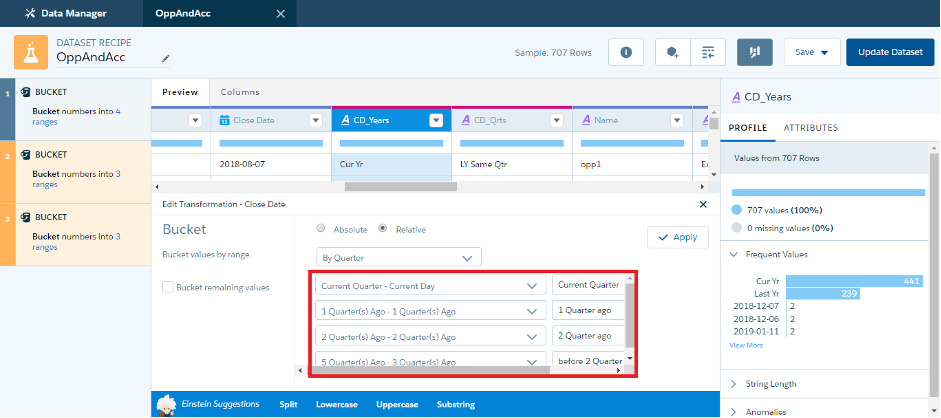
Additional Conditions – Bucket
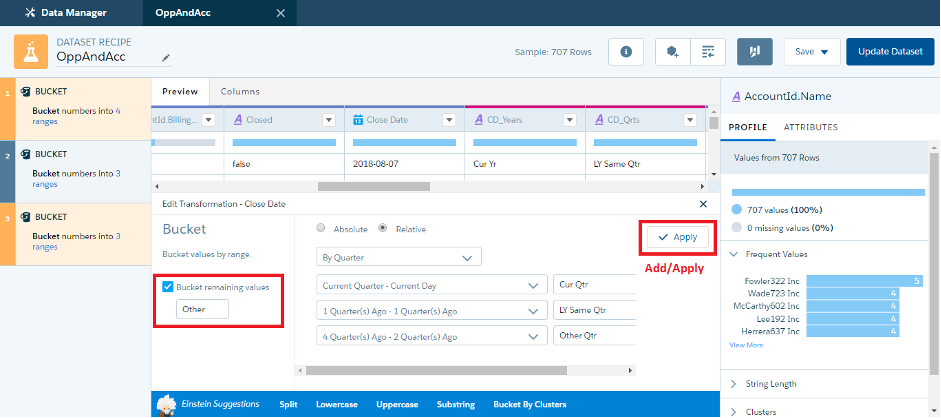
Select Bucket Remaining Values to Other and Apply changes to Bucket
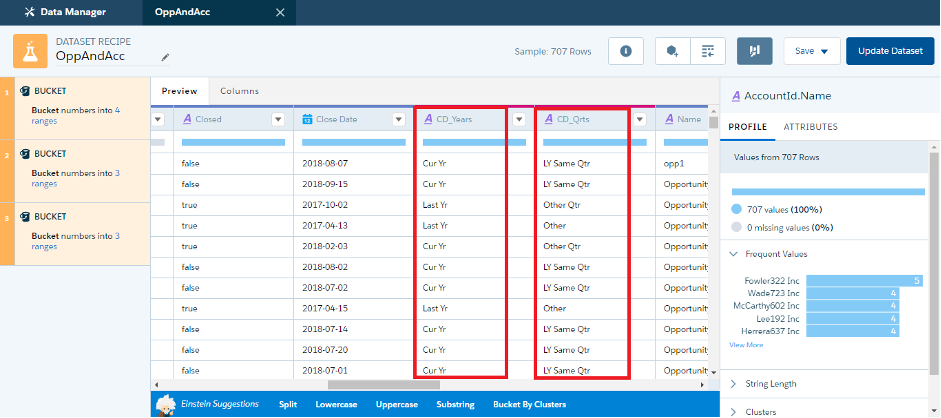
Find Recipe after successful creation
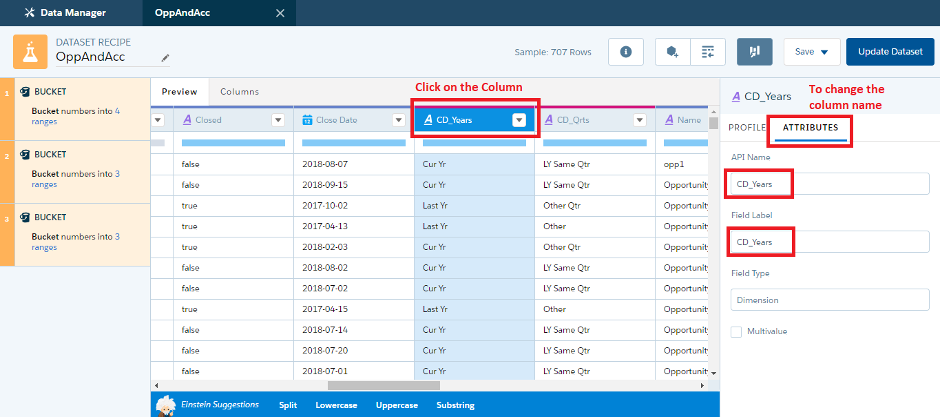
Steps to update attributes for column in dataset recipe
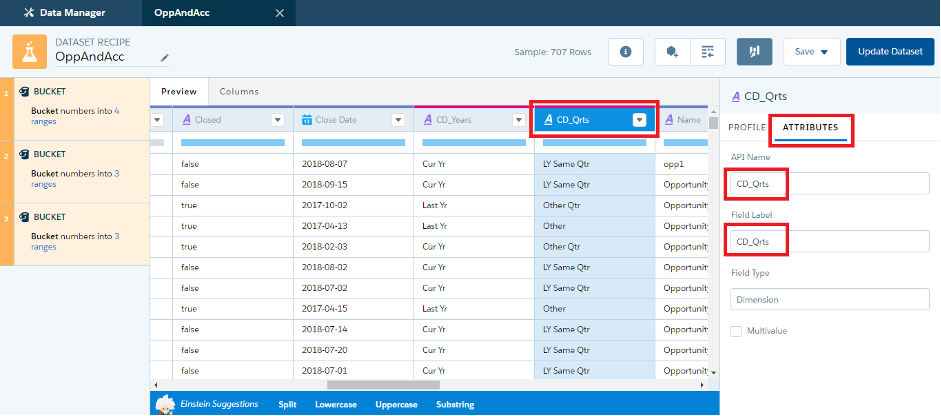
Updating Attributes for Column in Dataset
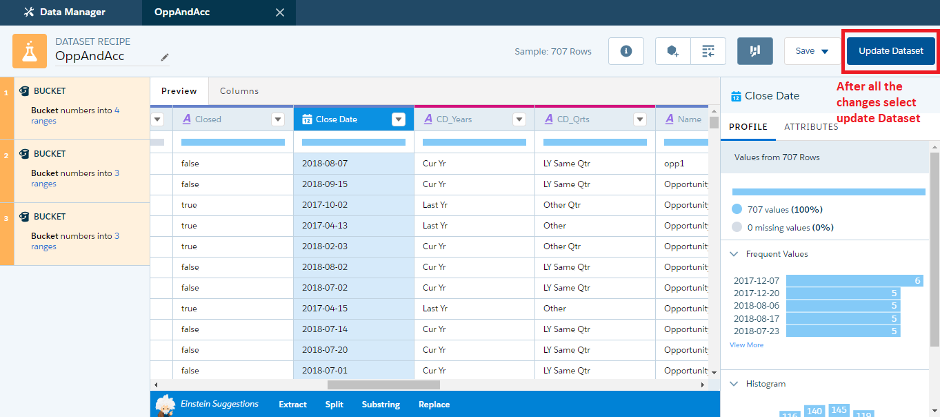
Saving changes to the Dataset
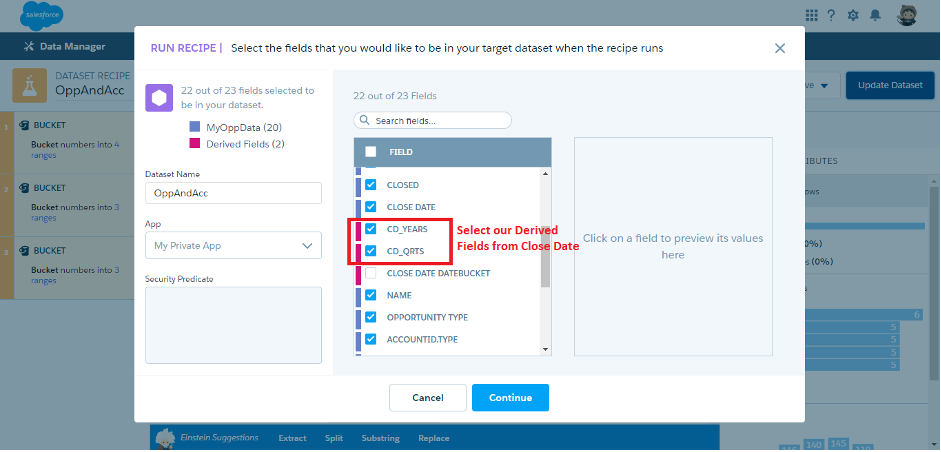
Select our Derived fields from Close Date
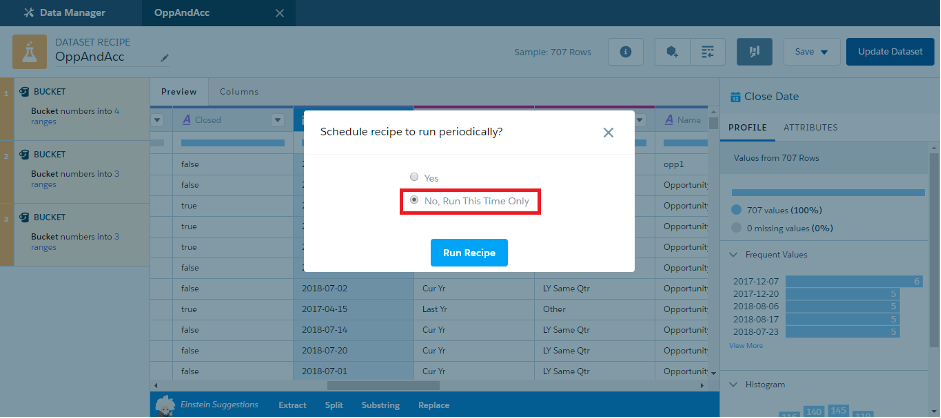
Running the Recipe – One time or Scheduled
Find Recipe after successful creation
Create a Dashboard
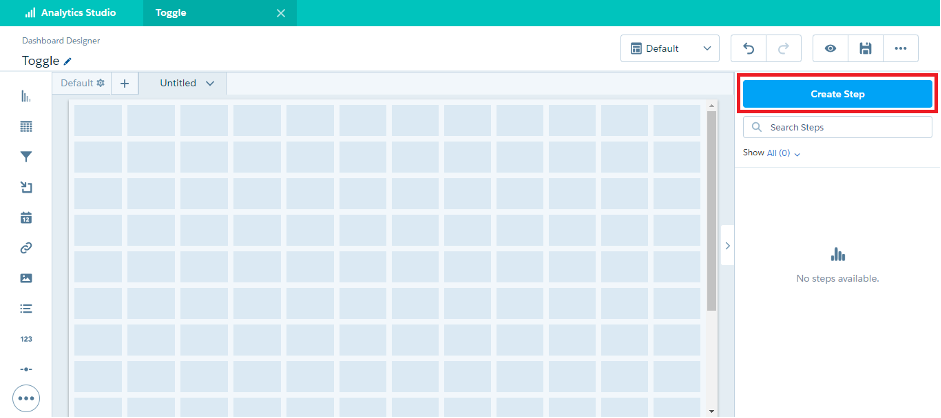
The Dashboard is where users explore and analyse widgets, So go ahead and create a blank Dashboard and rename it to a more specific and suitable description.
Create a Step
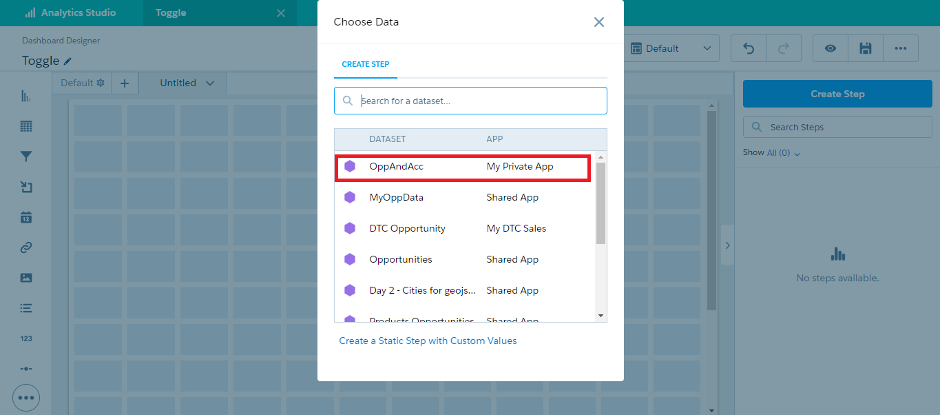
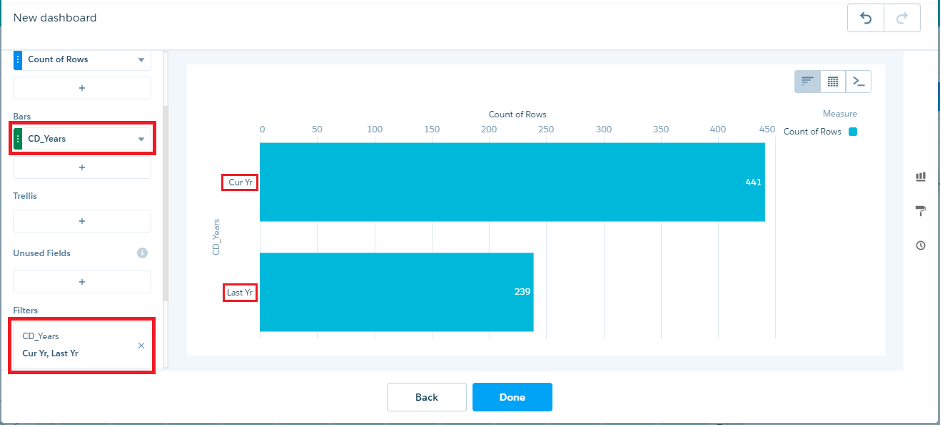
Create a step to add a toggle option. So first click on Create a step and choose the dataset you have created at the start. In the left side panel, under Bars choose Quarterly according to your naming’s saved above. Add a condition under Filters, choosing Quarterly equals to Current Quarter and Last year’s same Quarter. After following the steps as mentioned click on done. On the Dashboard, you can see the created step.
Creating step for a Toggle Einstein Analytics
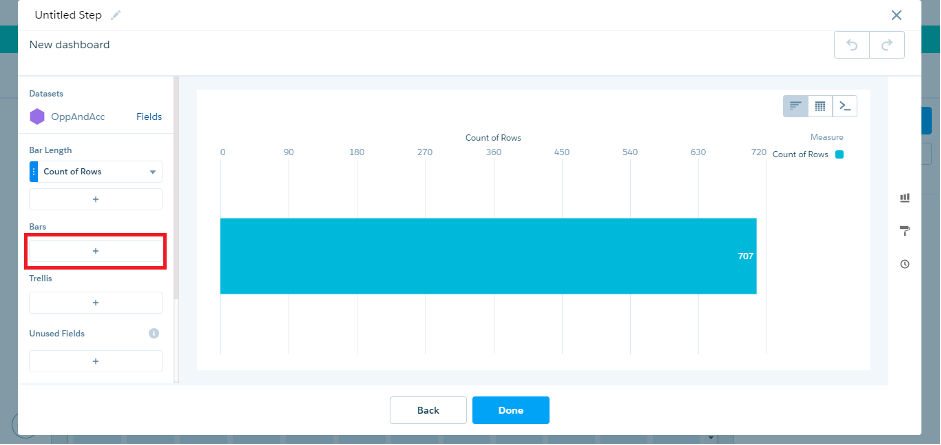
Add Bars to the Custom Step
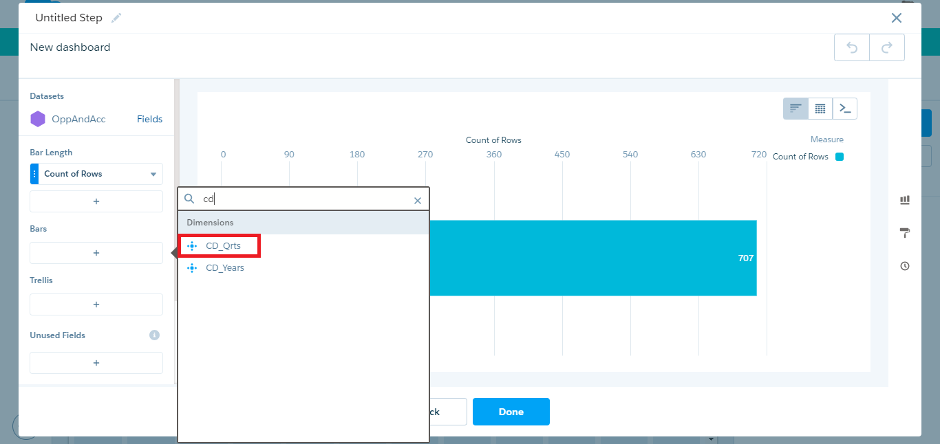
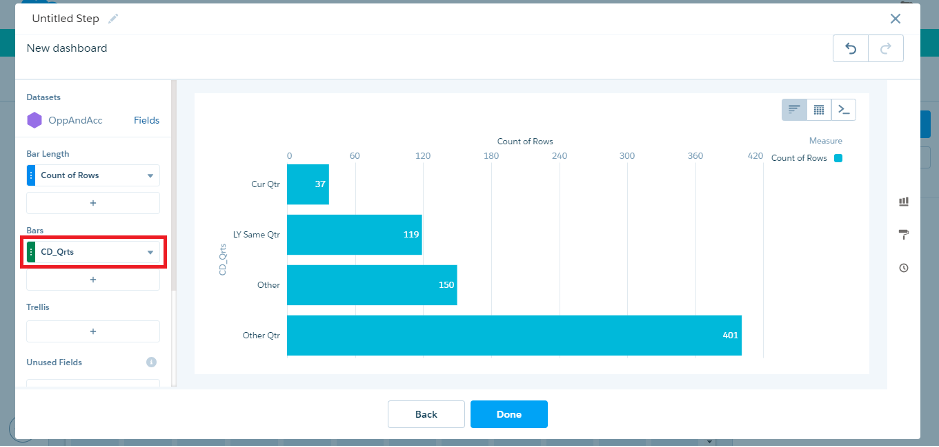
Ensure correct Bars are selected
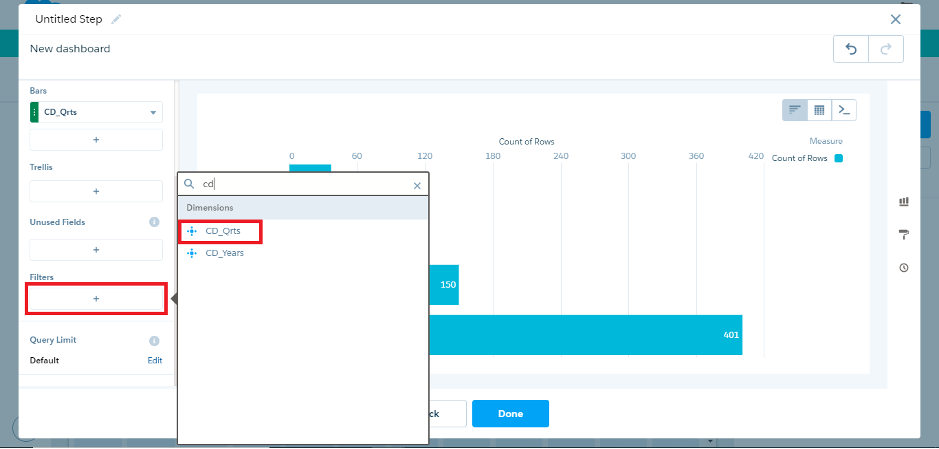
Select Filters from to Eliminate Unnecessary Dimensions
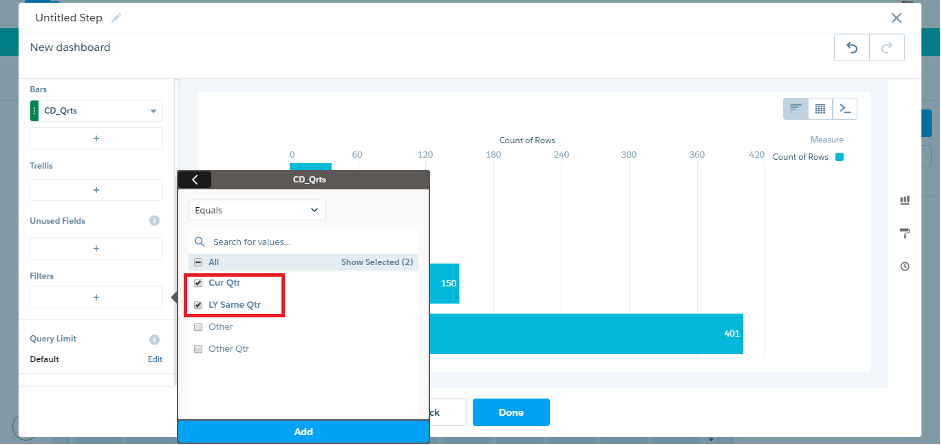
Select the required Dimensions
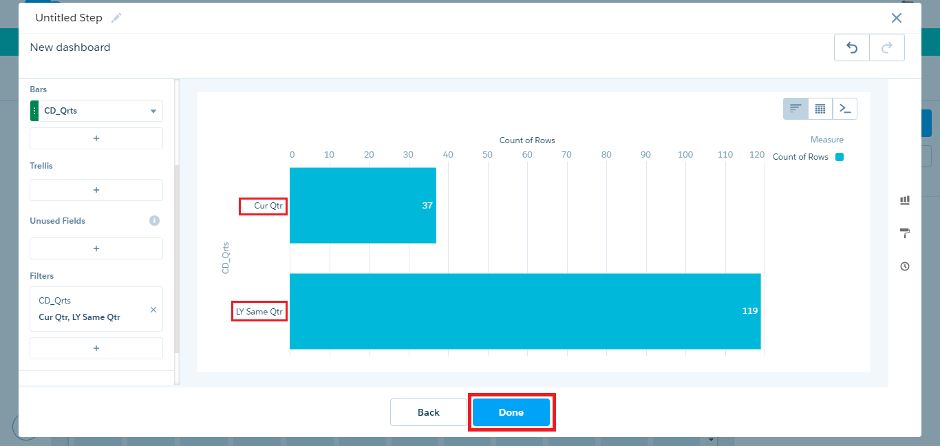
Click on Done after verifying correct selection of correct Dimensions in Step
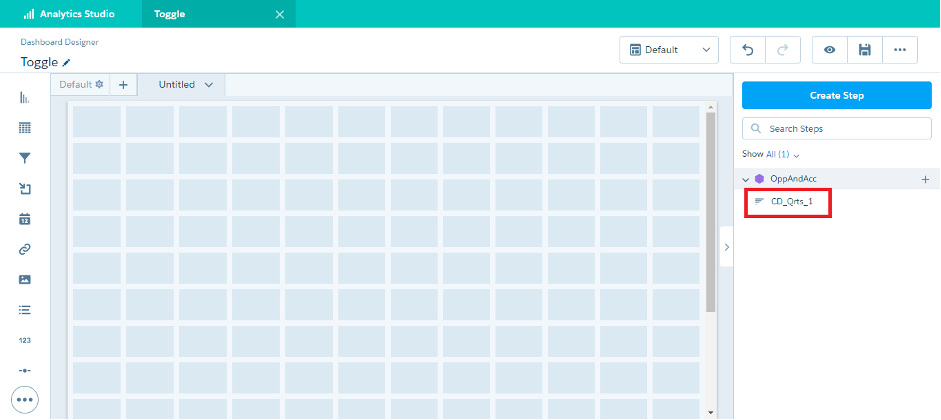
Step is visible in the Right pane of Toggle Designer
Create Toggle
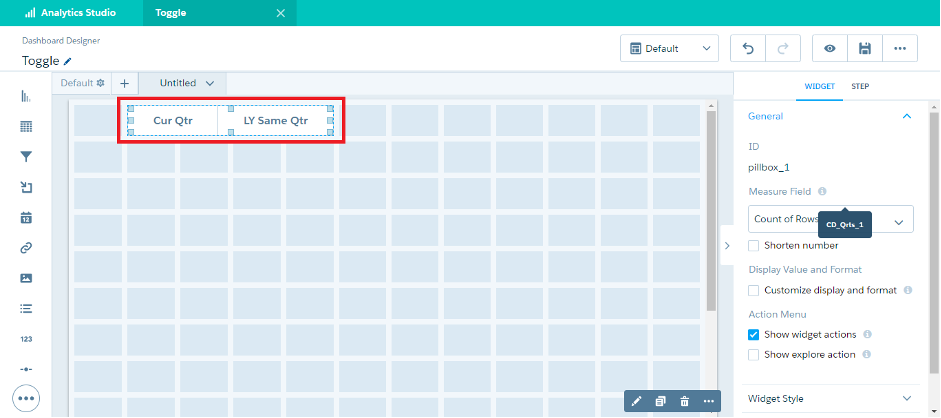
On the left side panel, select the Toggle option. Drag and drop the created step on the Toggle box. The options that are added to the filter are displayed on the Toggle.
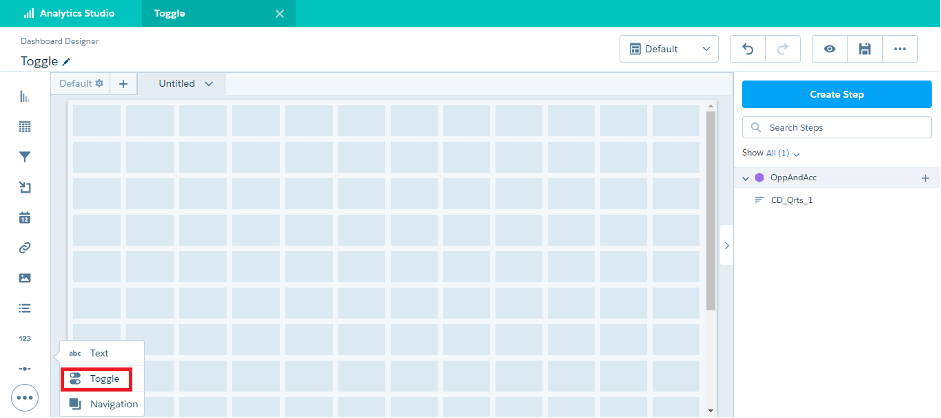
Select Toggle from Left Pane – Einstein Analytics
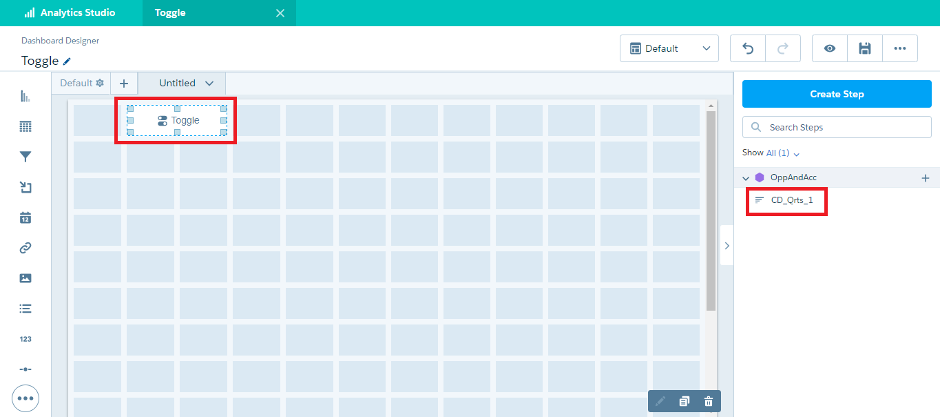
Drag Toggle to the designer pane and Select the Step Created earlier
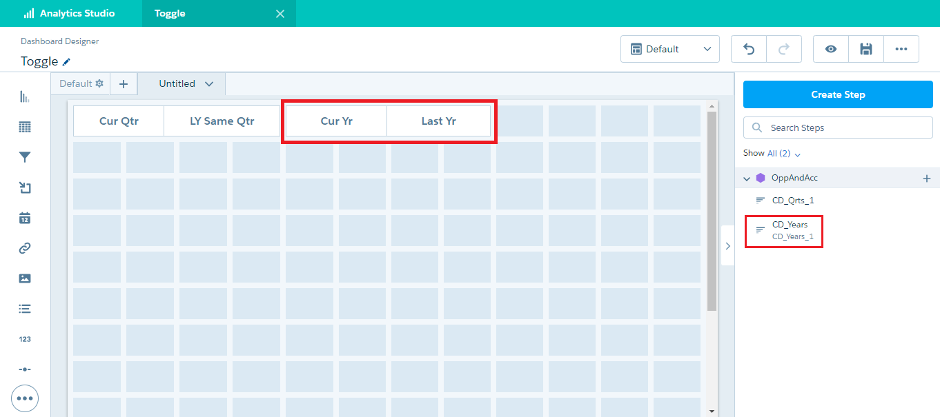
Create the same toggle for a current year and last year. Follow the same steps given above to create a step for Yearly.
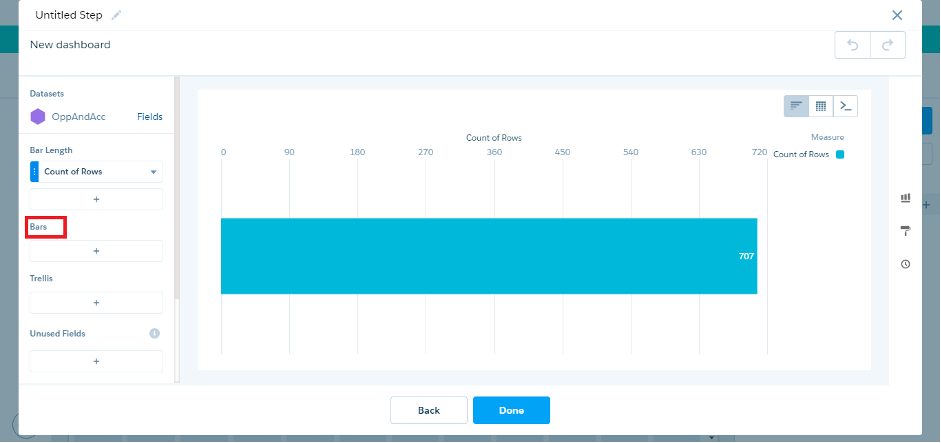
Create a Step
Now we create a step to show a chart with Account Industry data. Click on create a step and select under bars AccountId.Industry. Under Bar Length add criteria to count already available choosing the option: the sum of the amount. Rename the step and drag it to the Dashboard as shown below. Save your Dashboard and click on the preview to see how the toggle helps out.
Creating a new Step AccountId.Industry selecting our Dataset Recipe
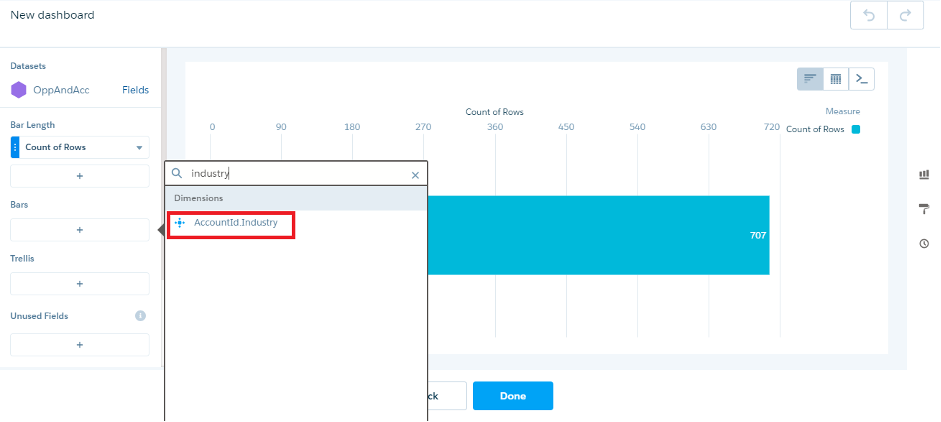
Select Bars – AccountId.Industry
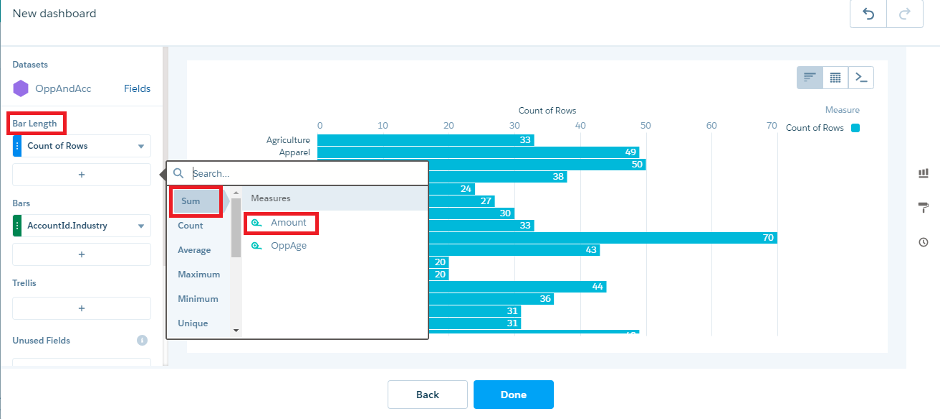
Select Bar Length – Sum of Amount
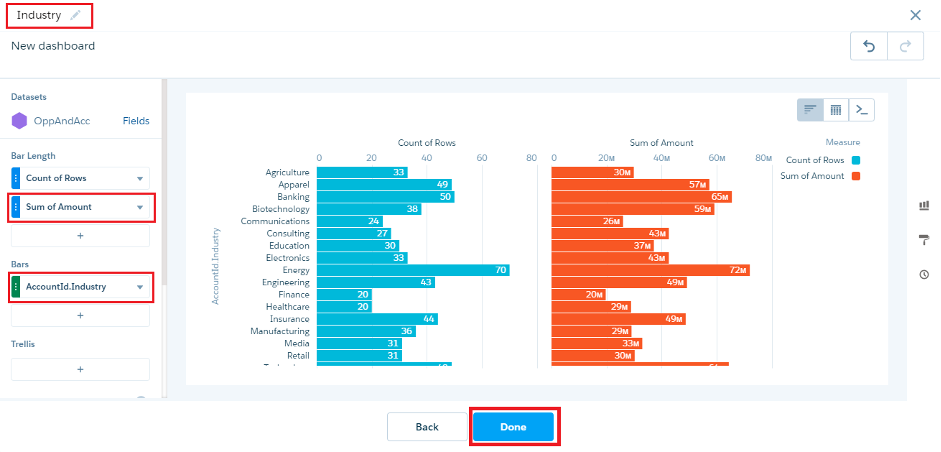
Rename Step, ensure the fields are reflecting correct data then hit “Done”
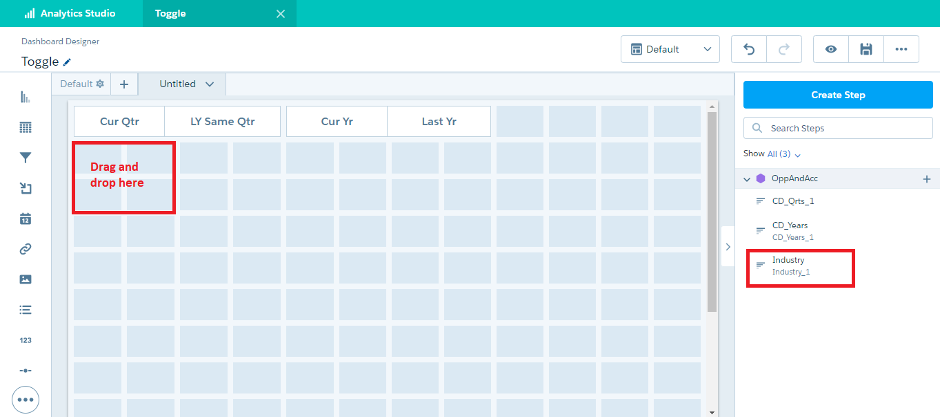
Drag Industry Step onto the Dashboard
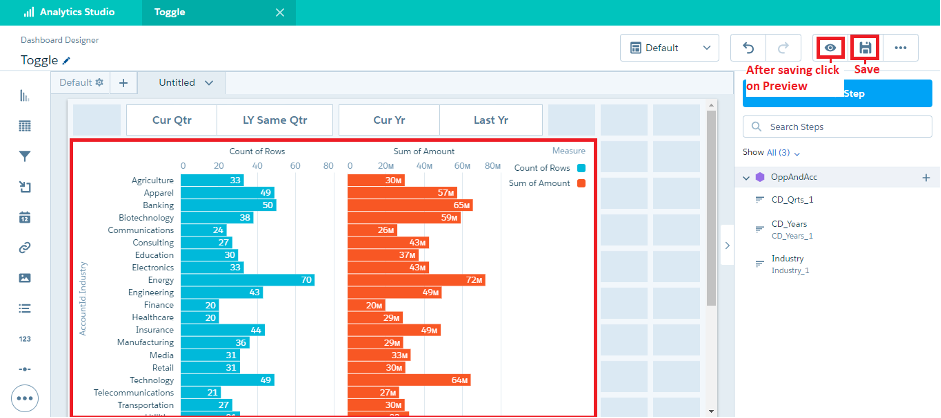
Save the Toggle Dashboard and Hit Preview
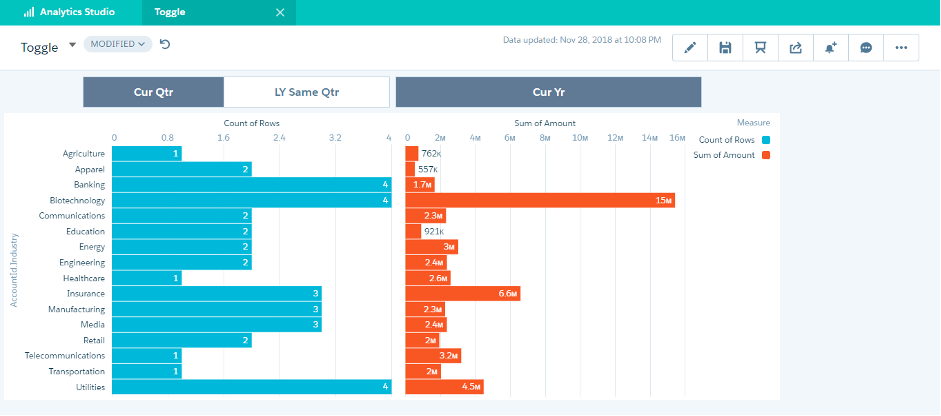
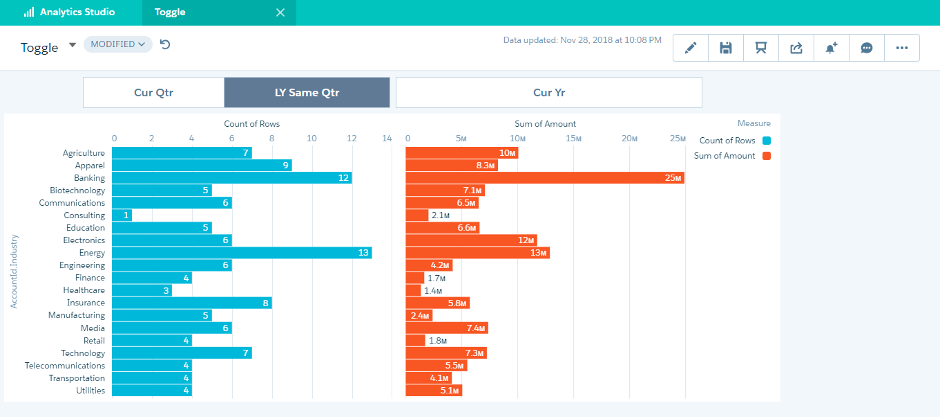
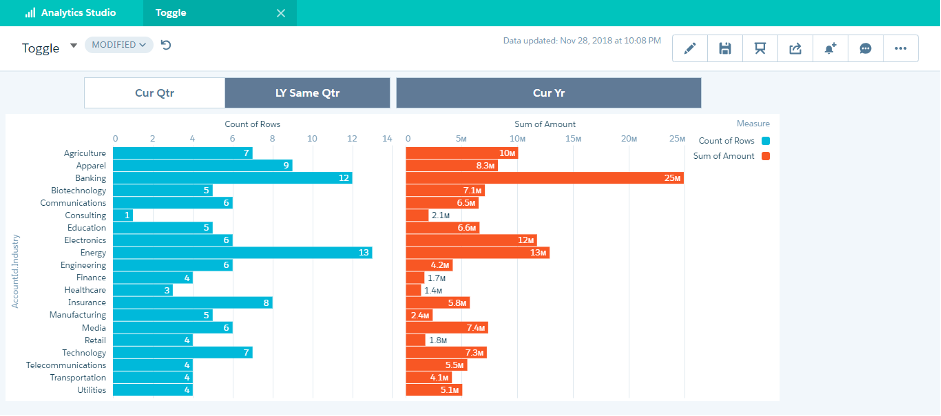
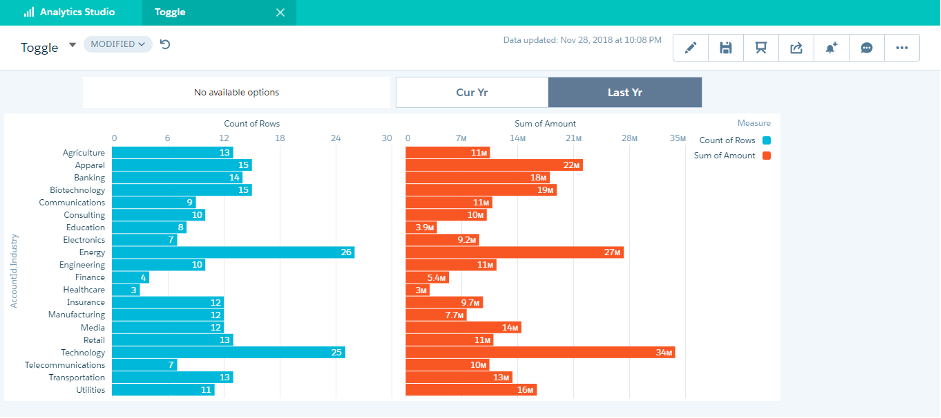
On Preview, you can see the output by selecting on the toggle options as shown below.
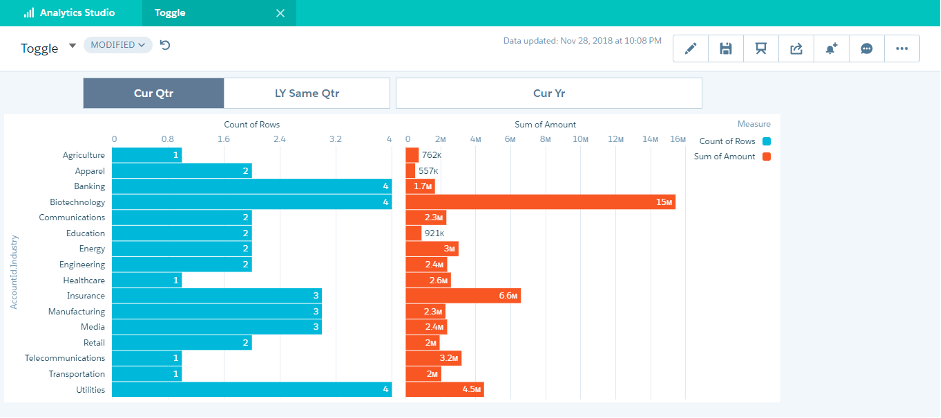
Preview – Einstein Analytics – Tableau – Current Quarter
So That’s it! If you are still facing problems, you can touch base with us over email team@absyz.com, we ABSYZ are one of the largest Salesforce integrators and a salesforce partner company providing End to End Salesforce implementation services for not just Tableau CRM but also for Salesforce Marketing Cloud and Salesforce Health Cloud. Do reach out to us for any help with integrations.