
Everyone loves a smooth and slick UI. And what if, if you have an awesome UI for which you have to design once and will work across the devices, which is nothing but responsive. One such library which was great but not supported in Lightning experience was Chart.js. As some of its external libraries had older versions, Chart.js wasn’t supported in Lightning Locker Service. Oh, wait a min, what is a Locker Service? That itself is a story to tell about for another day. Anyways you can check out the documentation here (Lightning locker service).
But that is not the situation now. Due to the latest version updates of Chart.js, it is finally compatible with Lightning Locker Service. You may be wondering how can I implement Chart.js in my org? Well, through this blog post am going to explain how to build a Generic Chart.js Lightning component and by the end of it you will be able to show off awesome, responsive and eye-candy charts to your peers.
I have created a generic component which will work for all the SObjects with the configuration on component level. You can use this component anywhere.
Here I have used a design component to configure any Object and it’s picklist field which will be used in the calculation and displayed on the chart.
First, we need to create a static resource with chart.js latest file and include the static resource in the component. You can download the Chart.js file from here Download.
[sourcecode language=”Java”]
<ltng:require scripts=”{!$Resource.Chart_bundle_min_js}”>
[/sourcecode]
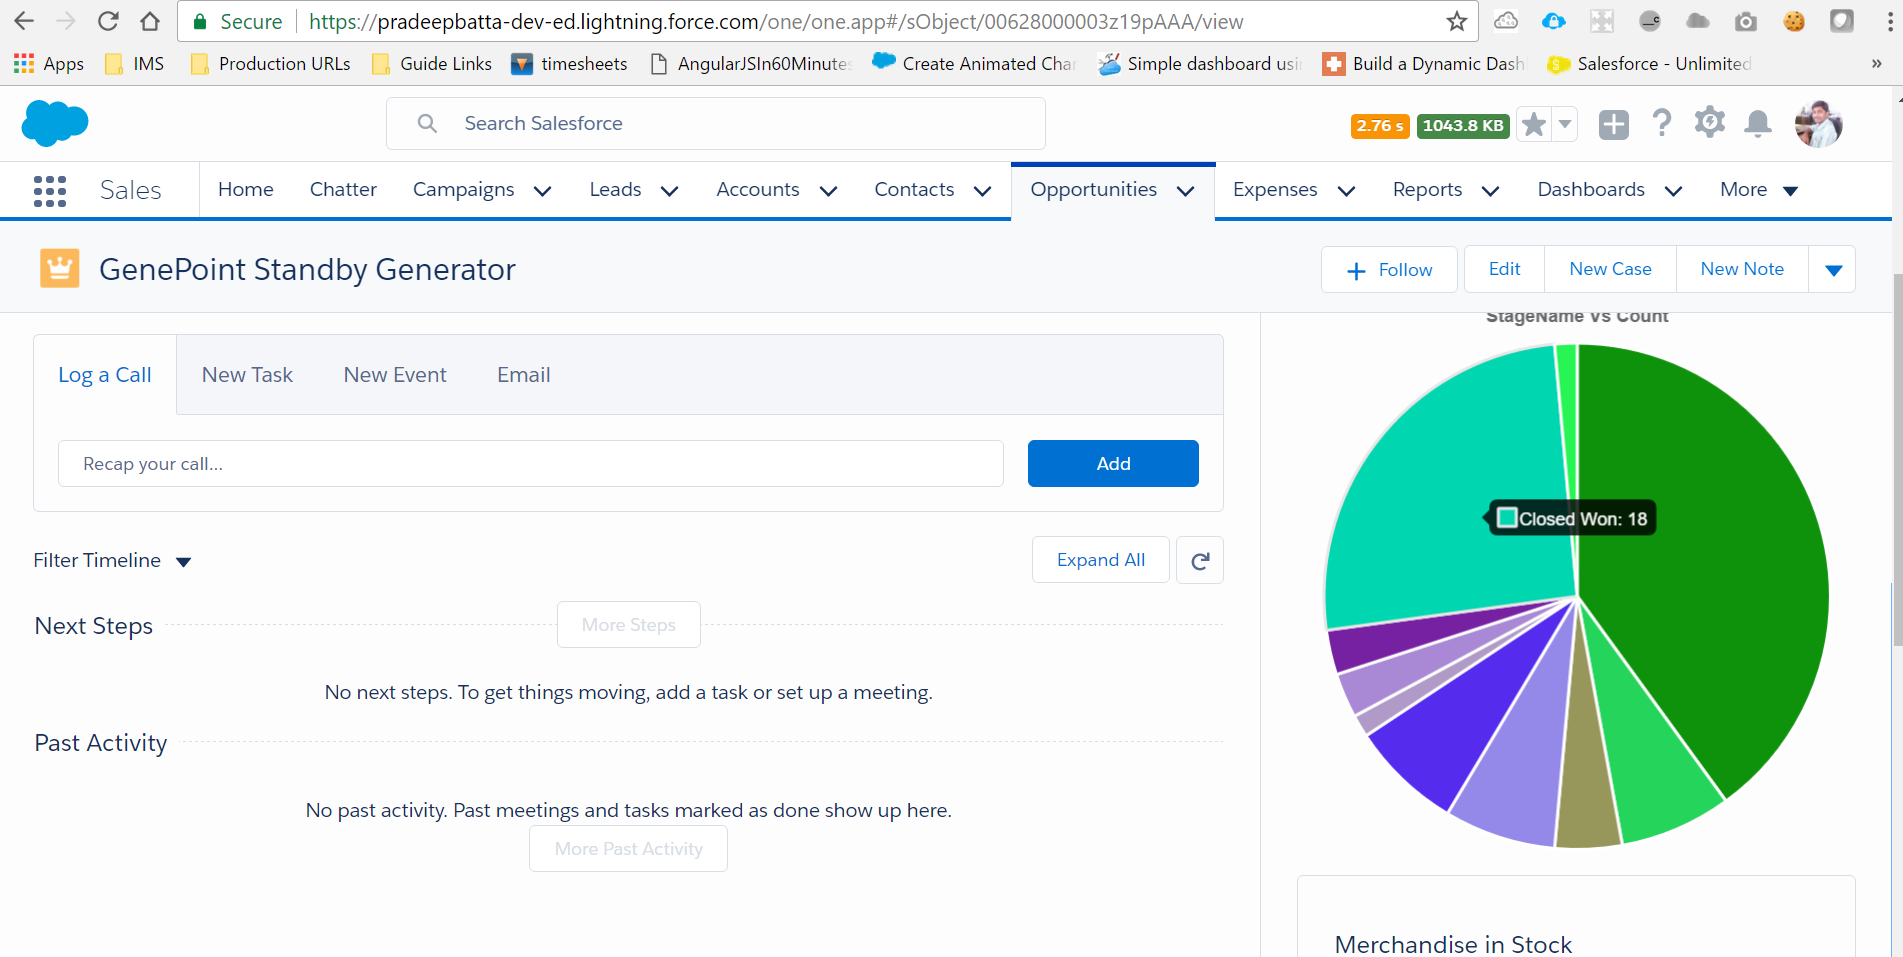
We can define which type of chart we want to display. Chart colours always keep changing when we refresh the page.
This is the javascript code I have used for dynamic colours.
[sourcecode language=”java”]
getRandomColor : function(component) {
var letters = ‘0123456789ABCDEF’;
var color = ‘#’;
for (var i = 0; i < 6; i++ ) {
color += letters[Math.floor(Math.random() * 16)];
}
return color;
}
[/sourcecode]
Here is the method to retrieve records:
[sourcecode language=”java”]
// Method to query the data from SObject
@AuraEnabled
public static List<wrapperclass> generateDataa(String selectedObject, String selectedfield) {
String QueryStr = queryAllFrom(selectedObject);
List<Sobject> groupedResults = Database.query(QueryStr); // Retrive the records from selected object
List<wrapperclass> lstofwrapperclass = new List<wrapperclass> (); // Wrapper calss to hold records with selected field value
Map<String, Schema.SObjectType> schemaMap = Schema.getGlobalDescribe(); // Describing the SObjects
Map<string, string> Mapofpicklist = new Map<string, string> ();
List<String> options = new List<String> ();
Schema.sObjectType sobjecttype = schemaMap.get(selectedObject); // Get SObject type
Schema.DescribeSObjectResult sobjectdescribe = sobjecttype.getDescribe(); // Describing the selected SObjects
Map<String, Schema.SObjectField> fieldmap = sobjectdescribe.fields.getMap(); // Holding SObject fields
for (Sobject sobj: groupedResults) {
for (Schema.SObjectField field: fieldMap.values()) {
if (string.valueof(field) == selectedfield) { // Checking the selected field
Schema.DescribeFieldResult fieldResult = field.getDescribe();
wrapperclass wrap = new wrapperclass();
wrap.selectedfield = String.valueof(sobj.get(fieldResult.getName())); // Assigning the selected field value of a record
wrap.lstofobj = sobj; // Assigning selected SObject record
lstofwrapperclass.add(wrap);
}
}
}
return lstofwrapperclass; // return the wrapper with records and selected field value
}
[/sourcecode]
This is where we have to configure the component and mention the API Name of the Object and it’s Field and also type of chart.
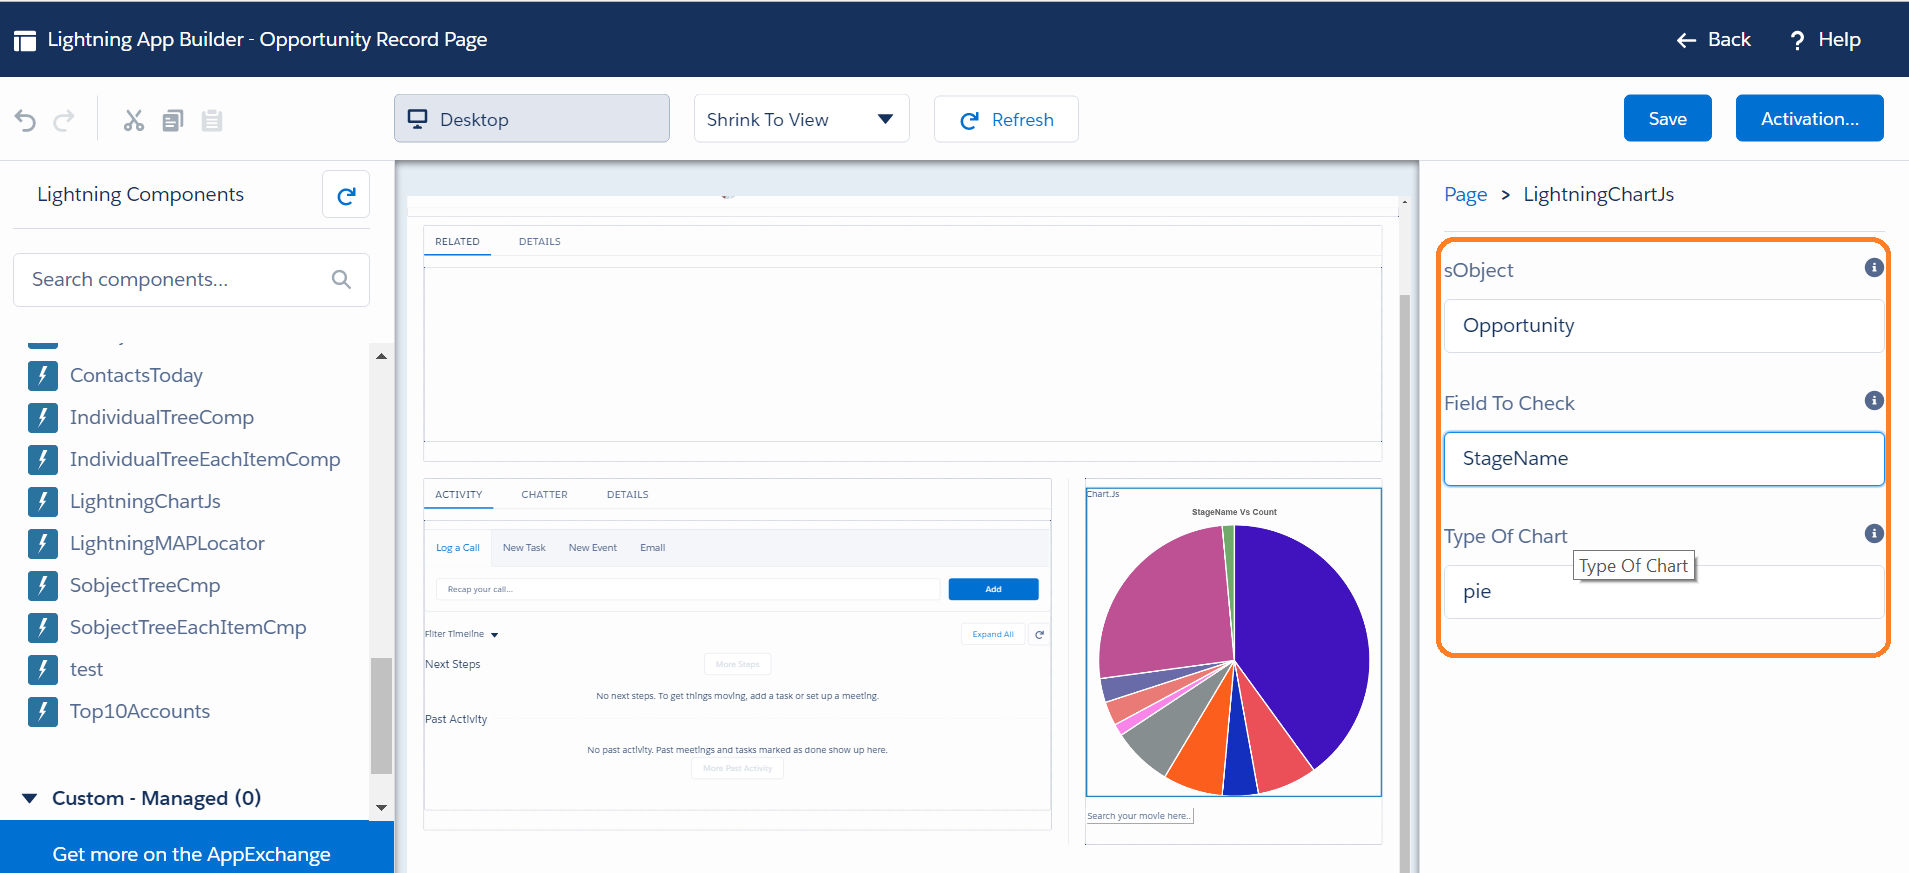
Final output of the component will be like this.
Note: My component supports bar, pie, doughnut charts. You can modify the Lightning controller for supporting more different charts.
References: View Code In Github